Image credit: Charlotte Edey
Who’s working in tech?
According to the U.S. Bureau of Labor Statistics, there are an estimated 12.4 million workers in information technology in the U.S. The industry is lucrative, and expanding. Technology companies account for 10% of the nation’s economy. The output of tech companies has greatly changed the ways in which we communicate, create, share, and play, in ways particularly palpable and beneficial during the covid-19 pandemic, which has digitized our once physical school, work, and social lives.

But who’s actually working in tech? Are perceptions of tech as a young and male dominated endeavor true? And what is the landscape of physical and mental health in these tech workers? We look into some of these answers, using data collected in the 2016 and 2018 Open Sourcing Mental Illness Mental Health in Tech Surveys.

Demographics
Where are the tech workers working?
Most of the respondents in both the 2016 and 2018 survey are working in the United States, followed by the United Kingdom. The following are the ten most common countries to work in tech, in descending order, reported in 2016 on the left, and 2018 on the right. The top four most popular countries to work in tech are the same in both years, but in 2018, there are the additions of Poland and India in the top ten.
| Rank | Country of work (2016) | Count | Country of work (2018) | Count | |
|---|---|---|---|---|---|
| 1 | USA | 851 | USA | 312 | |
| 2 | UK | 185 | UK | 19 | |
| 3 | Canada | 74 | Canada | 8 | |
| 4 | Germany | 58 | Germany | 7 | |
| 5 | Netherlands | 47 | Poland | 6 | |
| 6 | Australia | 34 | India | 5 | |
| 7 | Sweden | 20 | Netherlands | 5 | |
| 8 | Ireland | 15 | Australia | 4 | |
| 9 | France | 14 | France | 4 | |
| 10 | Brazil | 10 | Italy | 4 |
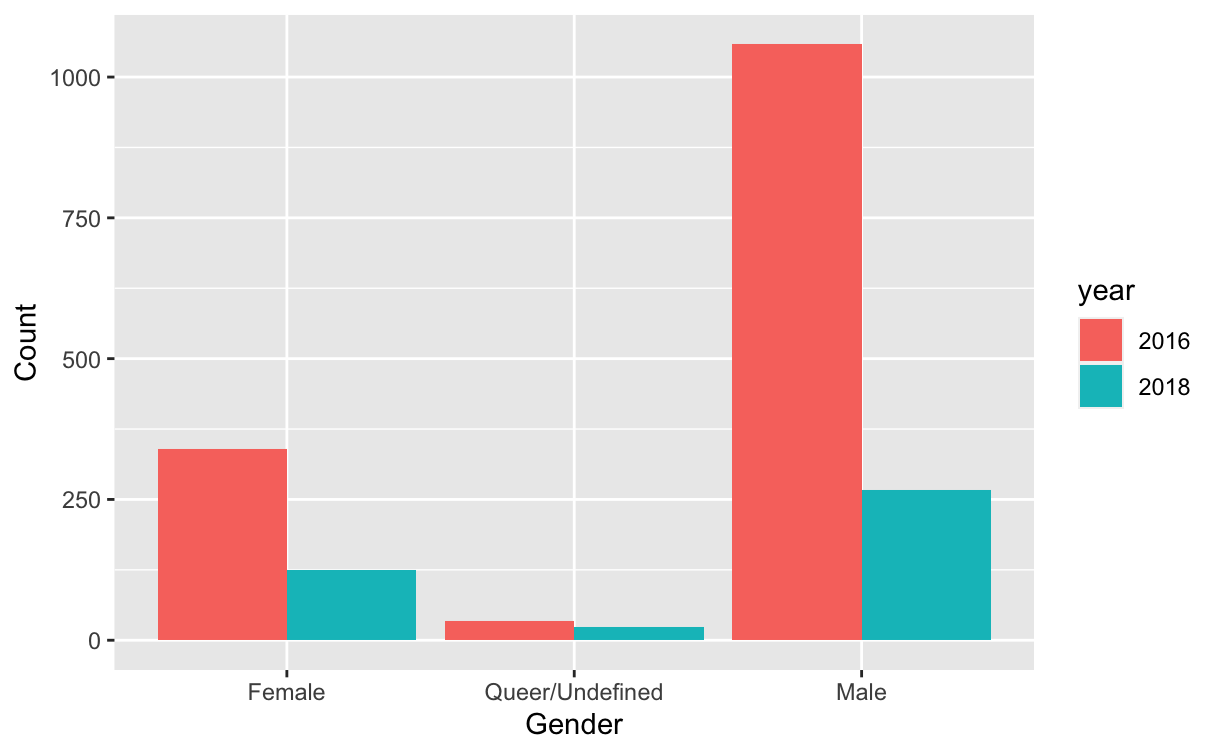
Is there diversity in tech?
Although many more workers responded to the survey in 2018 than 2016, the pattern of gender breakdowns in both years is similar: tech workers are predominantly male.
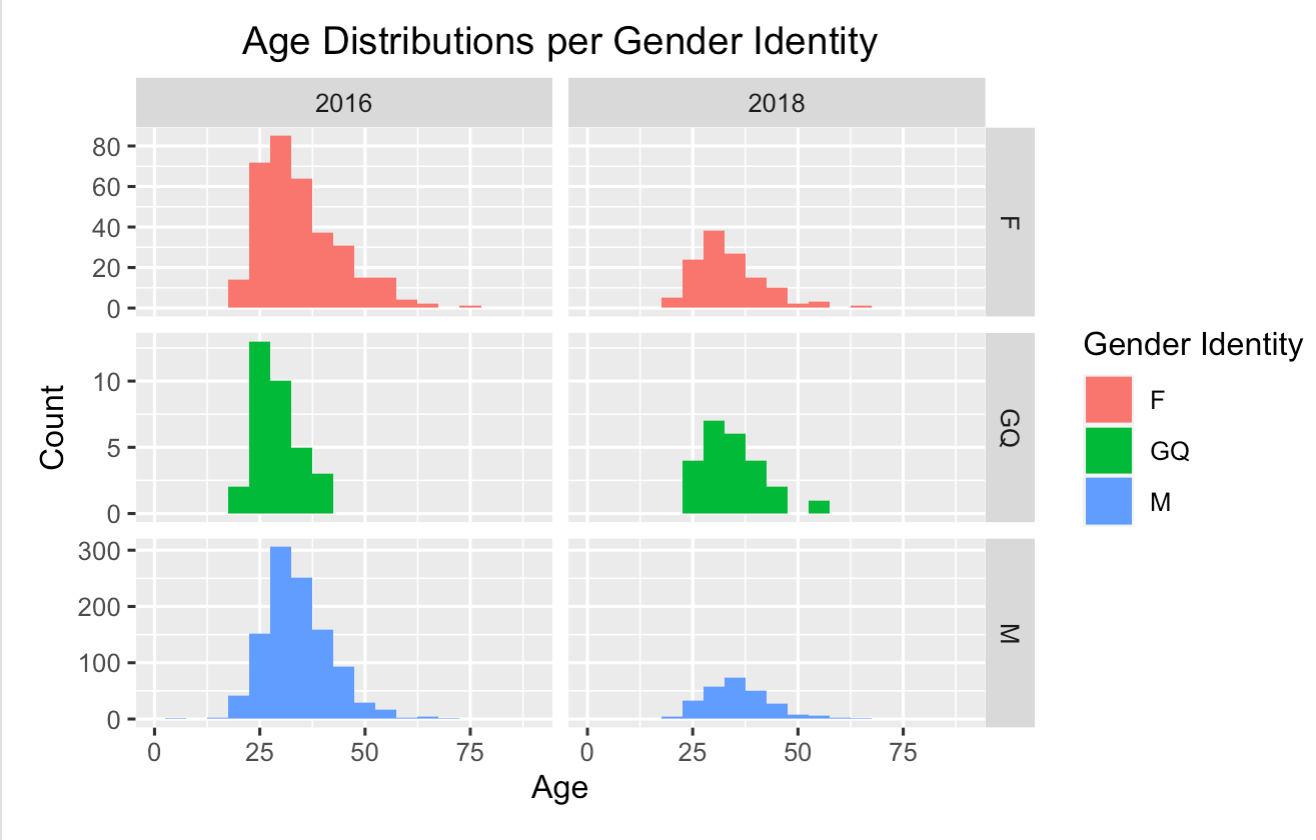
When we take in addition the consideration of age, we see most tech workers, across genders and across survey years, are relatively young, between 25-40 years old.
Why are there so few women in tech? Identifying and remedying dropout points, whether in encouraging early school STEM education in women and nonbinary individuals, in encouraging these underrepresented groups to study computer science in college and beyond, and encouraging workspace diversity and especially diversity in senior leadership, may help close the gender gap in tech.
Mental health in tech workers
We assess the prevalence of mental health disorders in tech workers. Of the respondents, 766 (41.4%) report having an ongoing mental health disorder, whereas many more individuals 949 (50.8%) report having had a mental health disorder in the past. This may be due to selection bias, in which individuals with acute, ongoing mental health disorders would less likely be reponsive to such a survey or currently employed in the tech industry.

These estimates of mental health prevalence in tech workers are higher than global estimates, in which the prevalence of ongoing mental health disorders of any kind is projected to be around one in ten people (10.7%), or 792 million individuals worldwide. As stated by the American Psychiatric Association, stigma against mental health, at the institutional and individually internalized levels, are very much prevalent, and so surveys of these kinds may underestimate the true number of individuals struggling. It is possible there is truly a higher prevelance of mental health disorders in tech workers than in the general global population—tech is a fast-pasted, demanding, and consequently, stressful, industry. It is, however, also possible respondents are more comfortable in admitting mental health issues in a survey like the OSMI that explicitly champions mental health.
Stigma and mental health
We further investigate the stigma surrounding mental health in the tech workplace. How strongly stigmatized is it? Has stigma evolved over time as the topic of mental health has garnered more attention? Does it vary between demographic groups? In order to uncover potential answers to these interesting questions, we developed a quantitative, overall measure of stigma for each survey participant: we called this metric the “stigma score.”
To generate this score, we quantified the responses to four questions related to stigma, then summed to arrive at an overall stigma score per respondent. The higher the numerical score, the greater the stigma we deemed surrounding mental health for that individual.
The questions we used to determined the stigma score were:
- [1] How difficult is it for you to ask for mental health related medical leave?
- [2] How comfortable are you in discussing mental health with a coworker?
- [3] How comfortable are you in discussing mental health with supervisors?
- [4] Are you willing to bring up mental health in an interview?
With this metric, we evaluated trends in stigma by gender and across time.
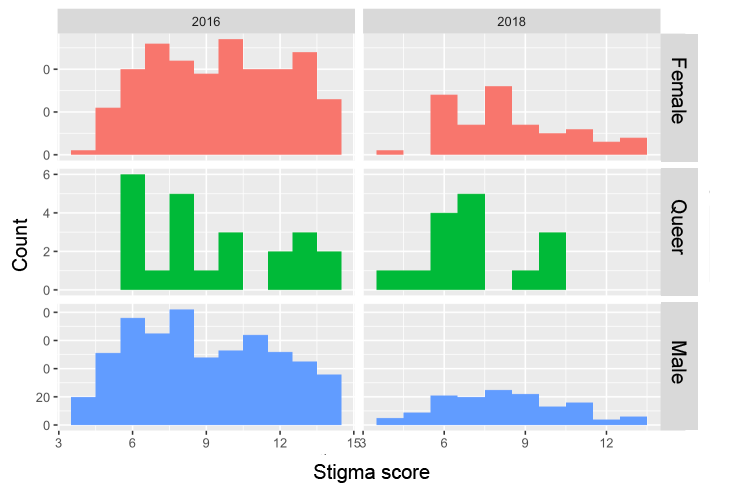
Comparing the stigma score by gender and by the two survey years, we find a promising trend: the average reported stigma is lower in 2018 than 2016, for all gender groups. This may reflect a changing sociological climate in attitudes towards mental health, and the increased advocacy in recent years for treatment and open discussions of mental health issues. Acknowledging mental health as important as physical health seems to be gaining footing institutionally, with some schools and workplaces offering now not only sick days for physical health but mental health.
| Gender | 2018 stigma score | 2016 stigma score |
|---|---|---|
| Female | 9.52 | 8.44 |
| Gender queer | 9.26 | 7.13 |
| Male | 8.92 | 8.23 |
In addition, we evaluated trends between stigma and age and how these trends may have changed over time. In our first model below, we analyzed how responses to the question “Would you feel comfortable talking to your supervisor about mental health?” varied with age.
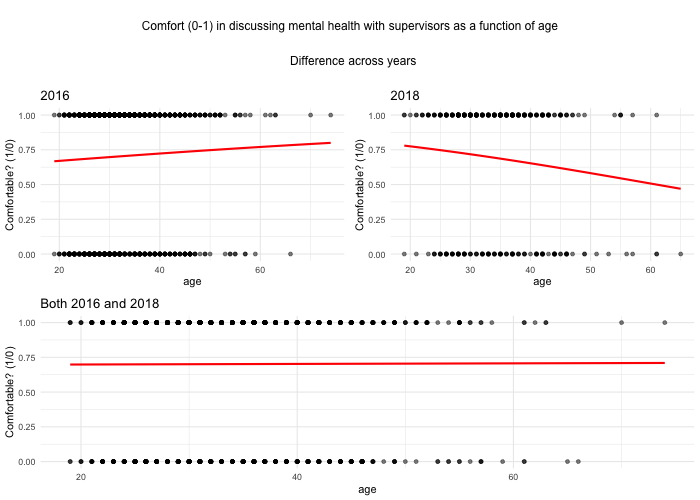
In our next model, we analyzed how our calculated overall stigma score varied with age as well.
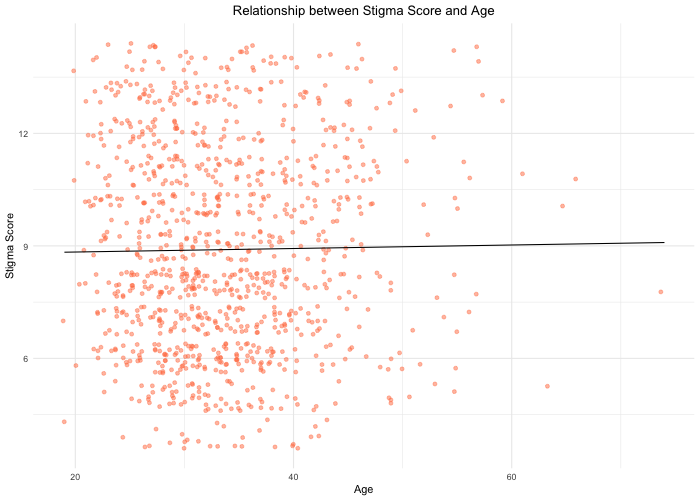
According to our analysis, a consistent relationship between age and stigma was not apparent. Further analysis of other datasets may be required in order to confirm or deny this relationship.
Mental health and family history
As mental health has a genetic component, we ask: does a family history of mental health disorder predict a respondent’s own presence of a mental health disorder?
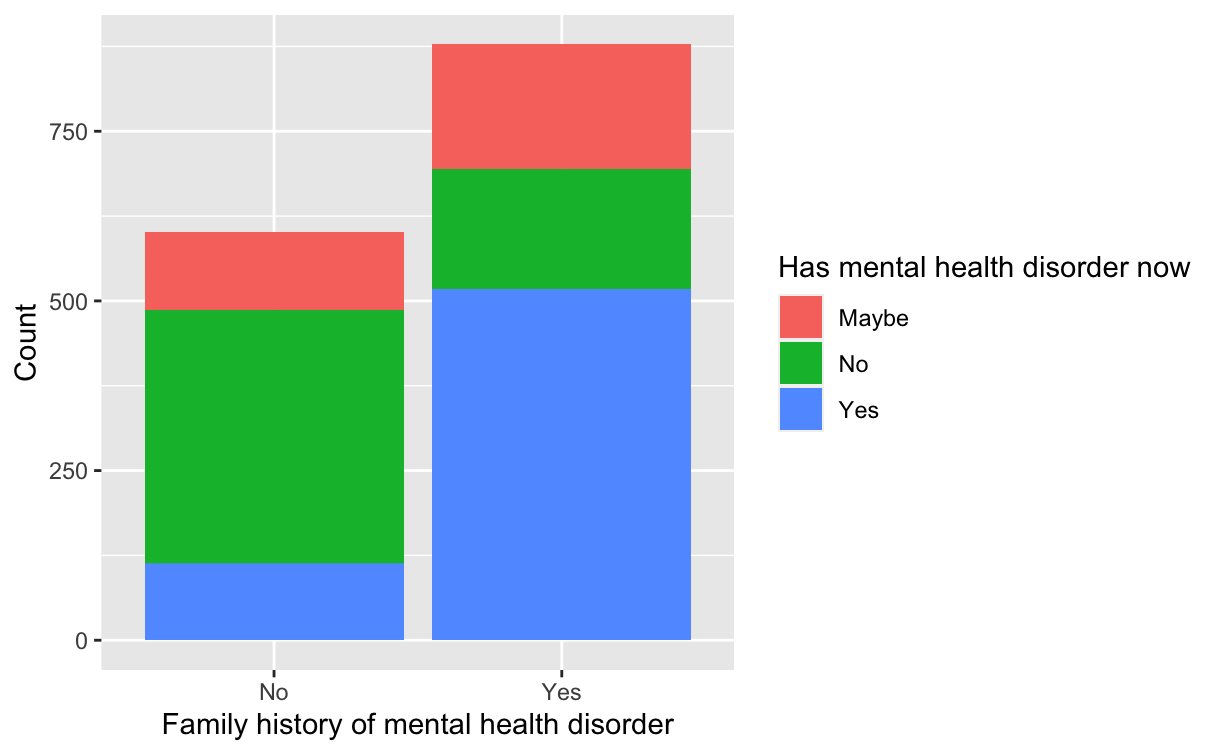
First, we check what is the likelihood of having a family history of mental health disorder. More respondents reported having a family history of mental disorder than not.
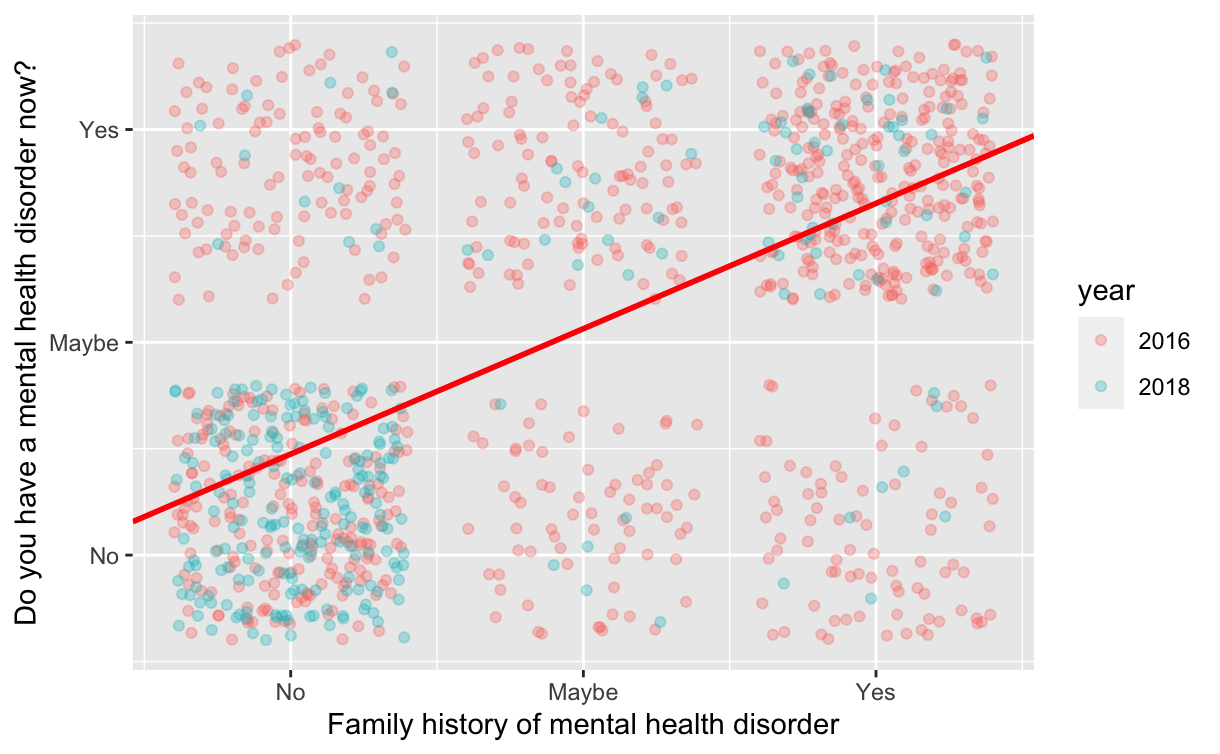
Compellingly, we find one’s own mental health is strongly related to the mental health history of family members, such that individuals with a high family history of mental health disorder are more likely of having a mental health disorder themselves. In red is the trend line, or the straight line that best models the relationship one’s own and one’s family’s mental health. The data here aligns with the idea of a hereditary component in mental health, in which one’s family history of mental health reveals genetic susceptibility for developing a mental health disorder.
Landscape of physical and mental health in tech workers
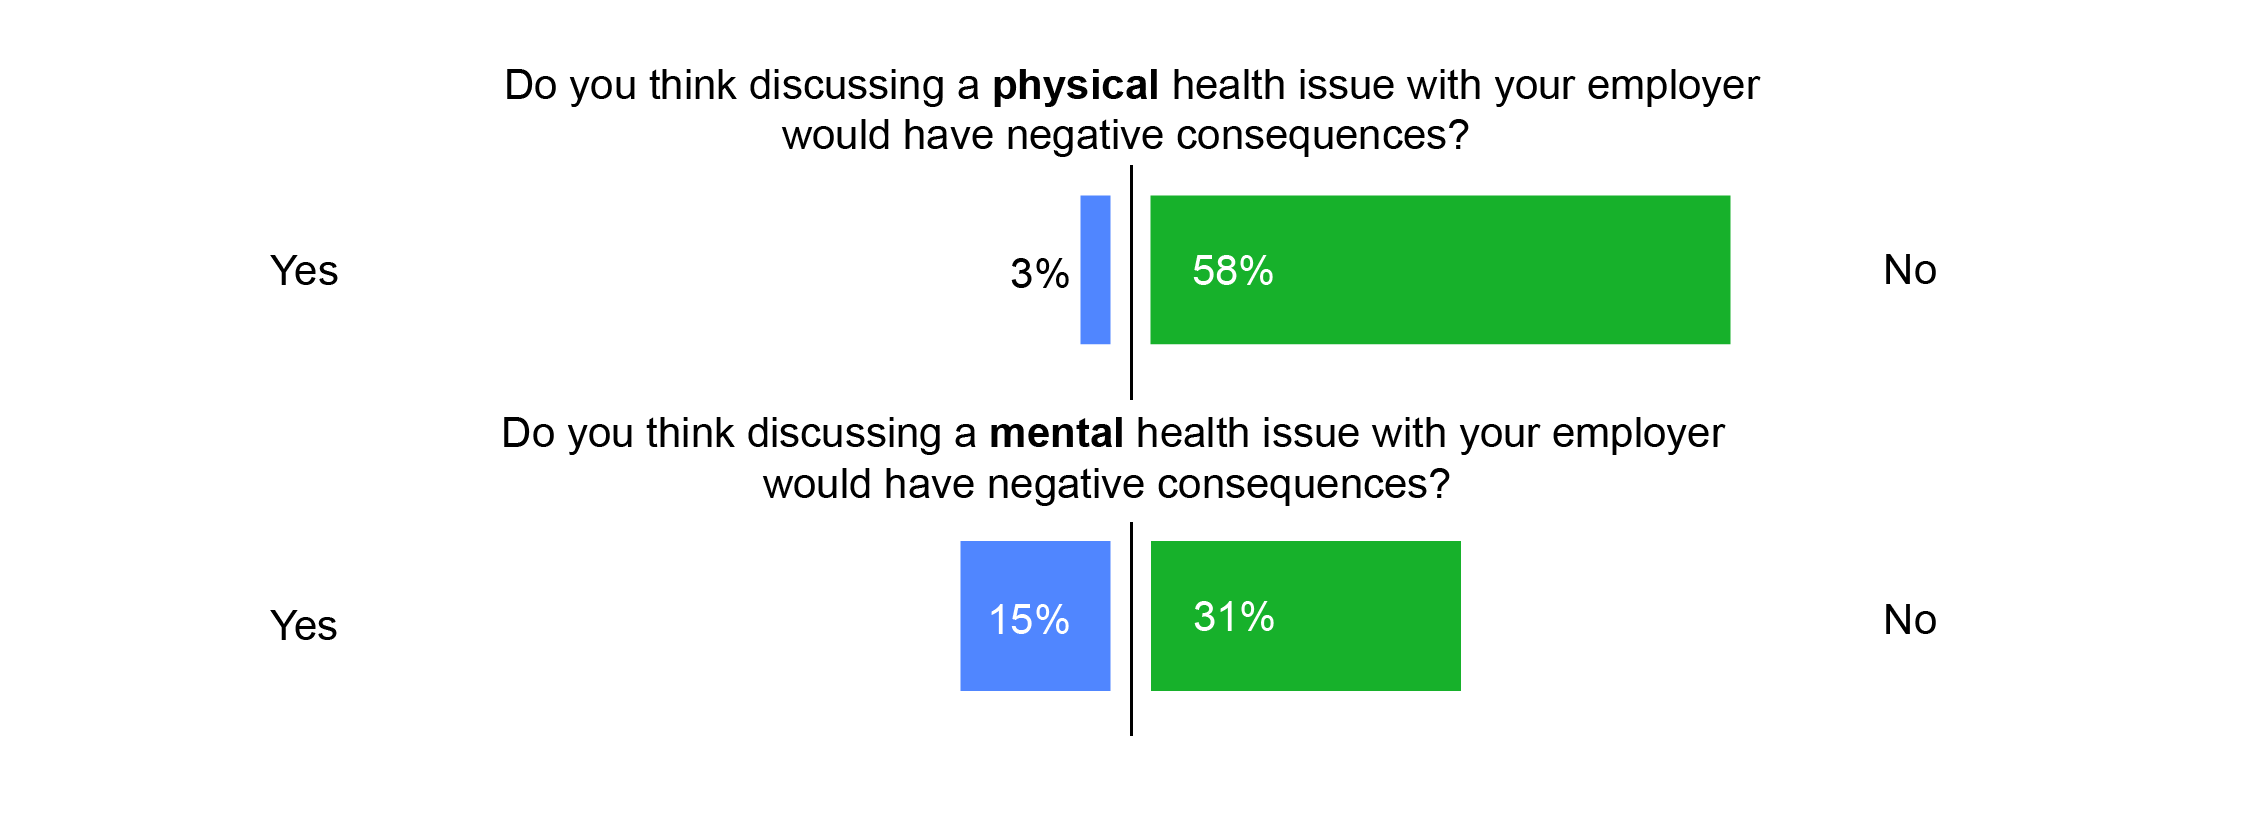
How does the stigma surrounding mental health compare to that of physical health? More tech workers report they think discussing a mental health issue with their employer would have negative consequences, than discussing a physical health issue. This further evidences that there still surrounds more stigma and less openness and comfort in discussing mental than physical health in the workplace.
An interactive look at demographics and stigma
For a more in-depth, high-level view of mental health in tech, we recommend checking out our interactive dashboard. It further explores attitudes towards mental and physical health, prevalence of mental health disorders among tech workers and possible stigma through interactive graphs and tables that are both informative and fun to play with!
Supporting mental health in the tech workspace
According to the NIH, the annual cost to the U.S. for treatment, social service, lost productivity, and related costs to mental health issues is more than $150 billion. Improving mental health lowers not only these monetary costs, but more importantly, the costs to well-being of workers in tech and the companies they work for. We’ve identified some potential factors for improving mental health in the tech workplace:
- Increasing diversity and decreasing ageism
- Lowering mental health stigma, so employees feel as comfortable discussing mental health issues as physical health ones, and employees feel comfortable asking for mental health related medical leave
- Recognizing the genetic susceptibility of mental health disorders, and providing extra support if signs of poor mental health are observed
Sensitivity to such factors may improve the quality of life and quality of output in the tech workspace, and support the mental health of its workers.