
In previous weeks we looked at the distributions of various individual variables within our data, now we move on to explore how some of them relate to each other. Analyzing the marginal distributions revealed a possible workplace stigma around discussing mental health in the workplace, this week we explore some possible contributors.
Does stigma increase or decrease with company size?
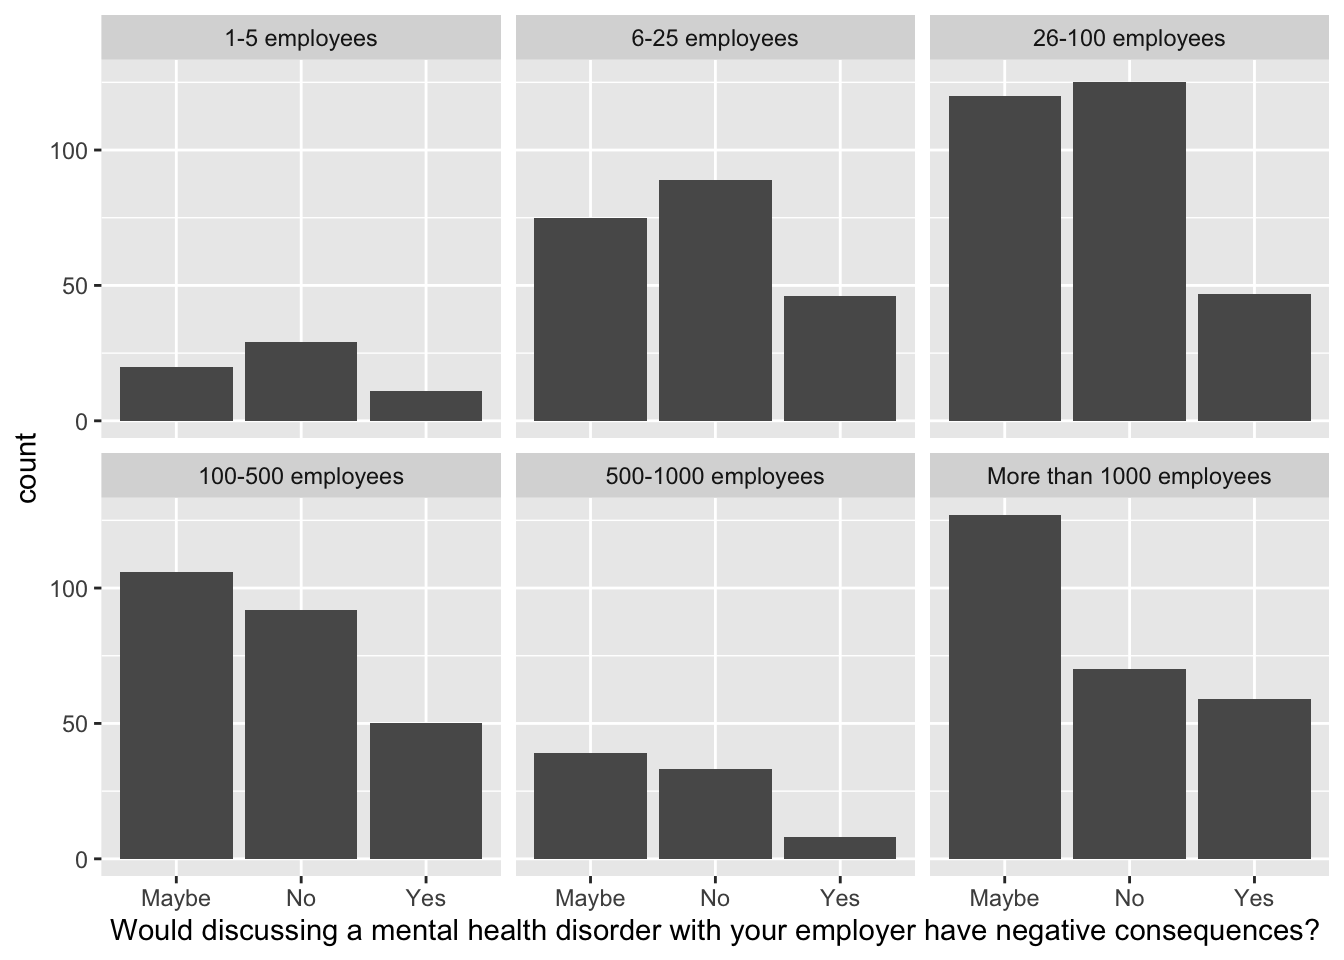
Using the question “Do you think that discussing a mental health disorder with your employer would have negative consequences?” as a possible stigma indicator reveals some interesting patterns in relation to company size. Though “yes” is the least common answer to this question for all company sizes, employees in larger companies (100+ employees) tend to answer with “maybe” rather than “no” more often, indicating that employees in smaller companies might be more comfortable with trusting superiors with mental health issues.
What changes if mental health has been discussed formally in the workplace?
One intuition is that if the employer discusses mental health, employees might be more comfortable discussing it.
| Has your employer ever formally discussed mental health? | n | p |
|---|---|---|
| I don’t know | 103 | 0.07 |
| No | 813 | 0.57 |
| Yes | 230 | 0.16 |
| NA | 287 | 0.20 |
A majority, 57%, of employers in our dataset has not discussed mental health formally with employees.
Now, setting this in relation to employees attitudes
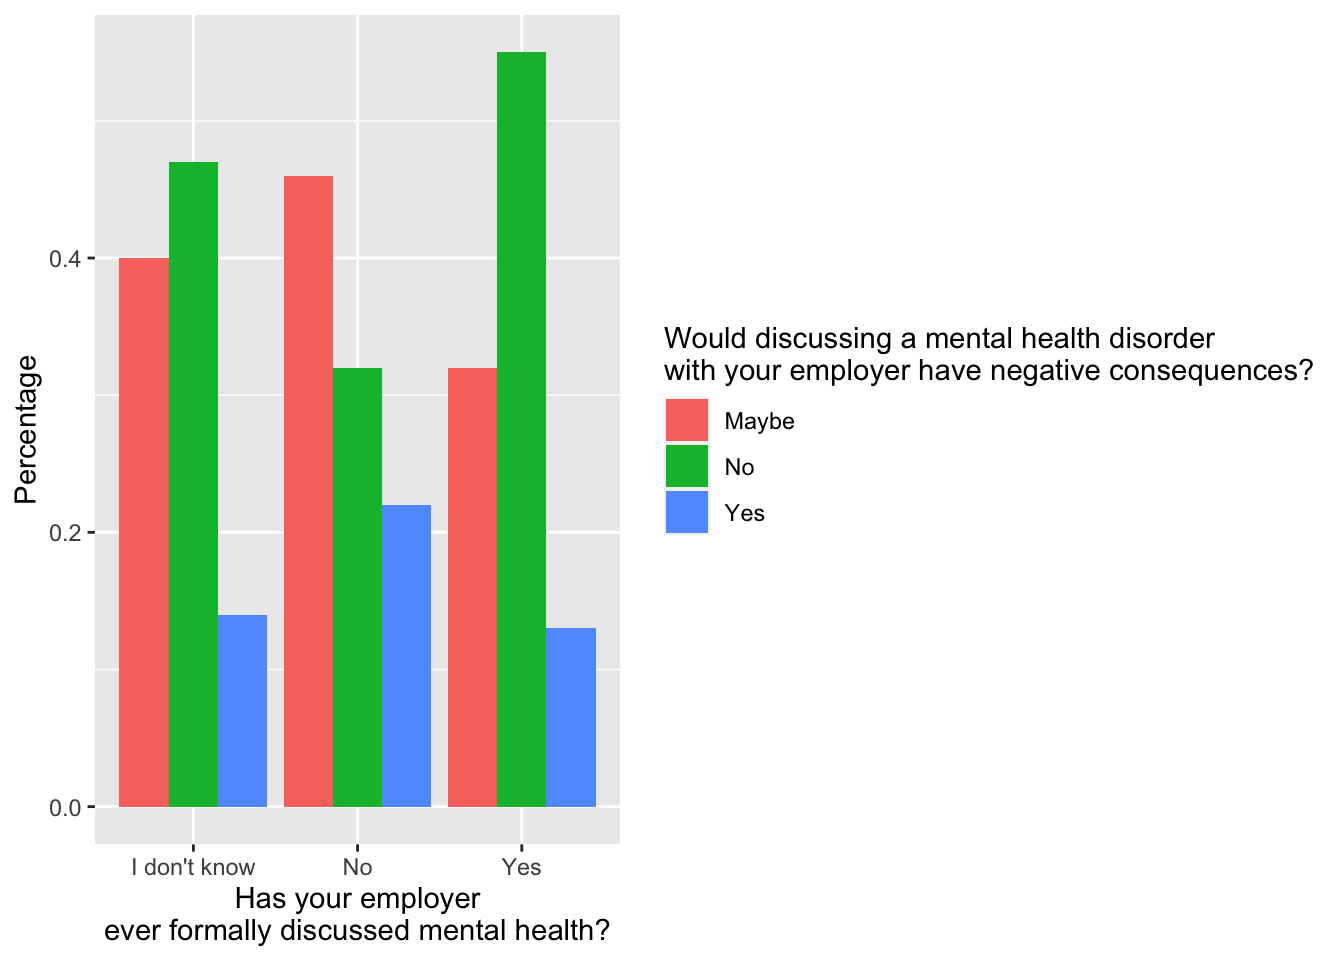
It is notable that by far the highest percentage of employee’s confidence in discussing mental health problems at work is in the scenarios where the employer has discussed mental health openly. Nearly 60% of employees where this is the case would not expect negative consequences of opennes about mental health. As contrast, only around 30% of employees with no discussion would have that same confidence.
Is there a relationship between age and attitude to mental health?
Perhaps age plays a role in mental health stigma. To explore this, we try fitting a logistic regression model of age predicting our stigma variable. (*Note, for the sake of simplicity, answers of “maybe” are counted as “yes” for the time being)
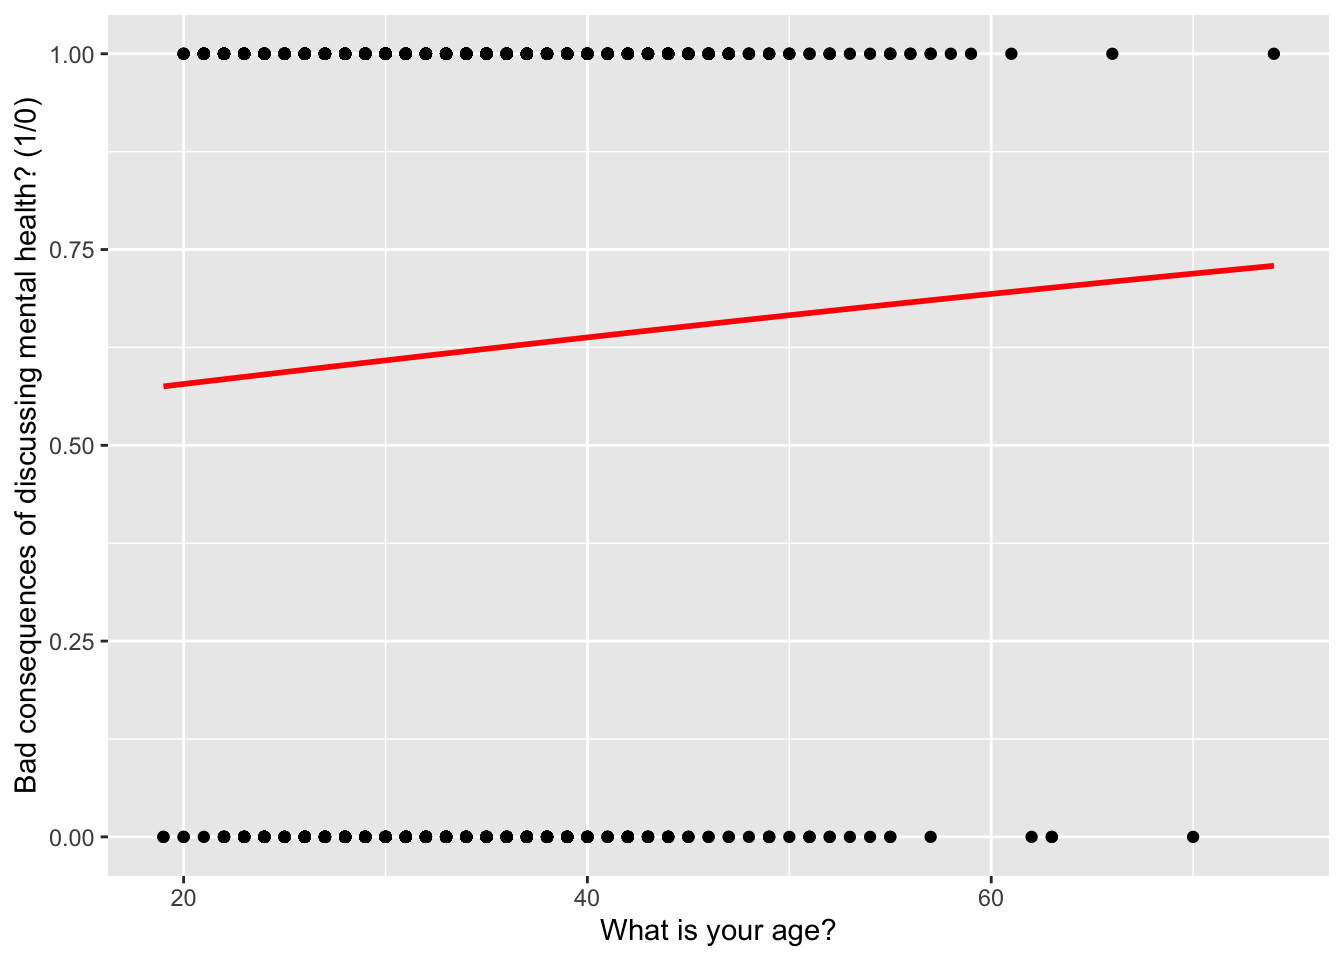
From this, there seems to be a slight increase in bias with higher age. Though that certainly lives up to the prejudices we millenials have against our parents/grandparents views, we should be careful to judge by this one graph and also note that the higher age groups are outliers. (The mean age being around 30 years).